UX Design and Research
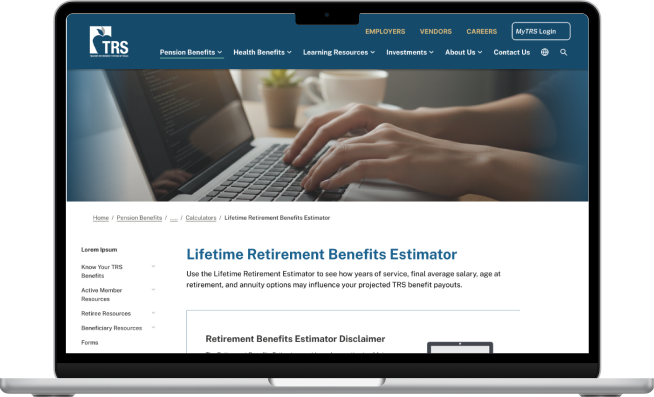
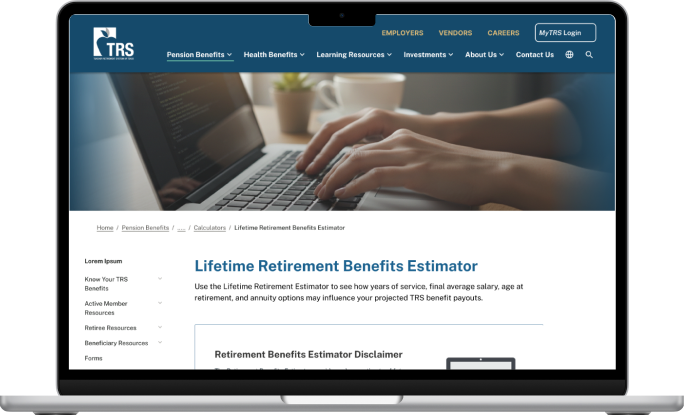
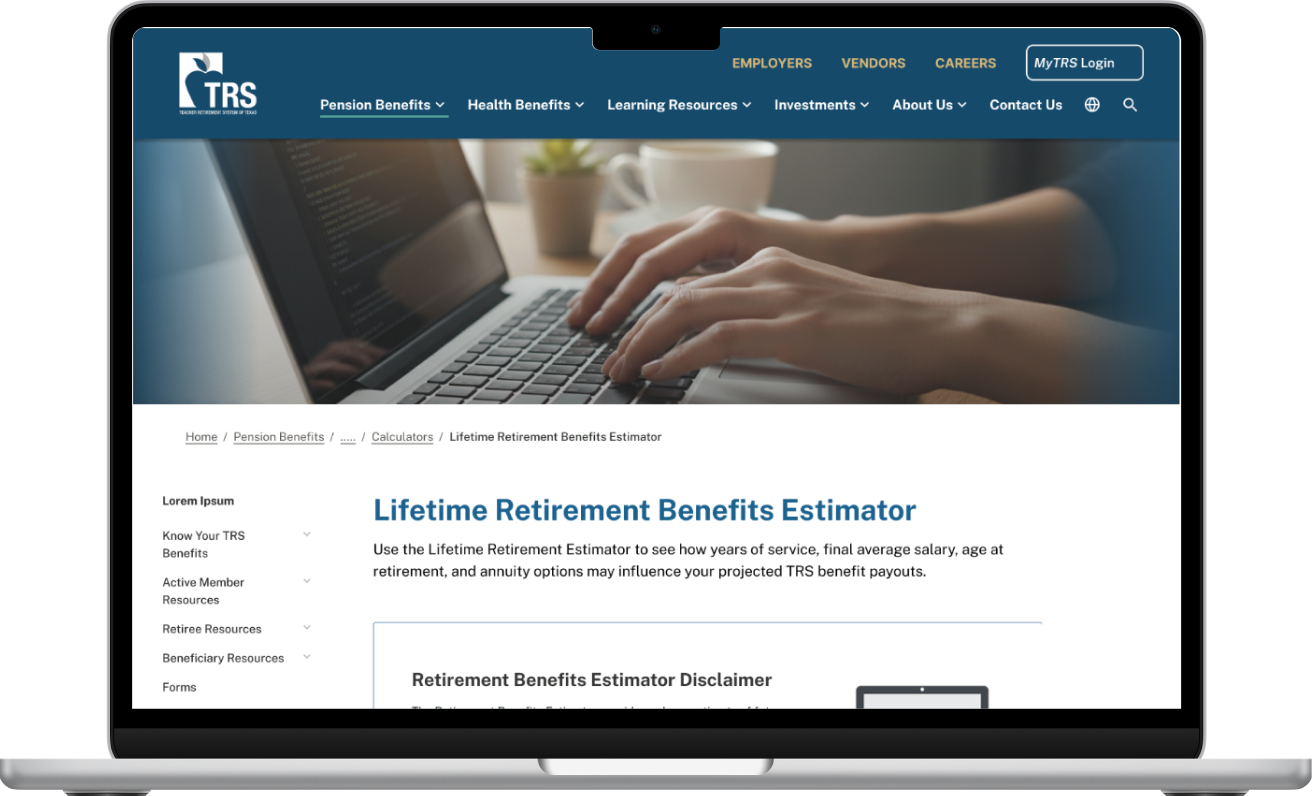
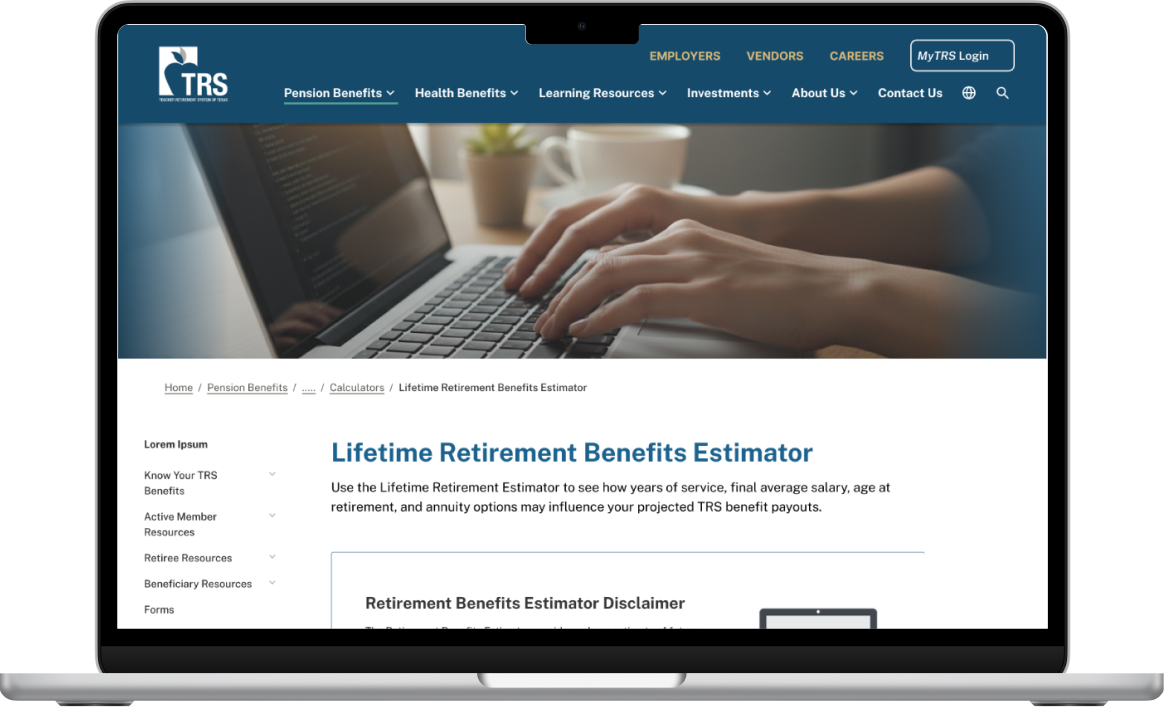
TRS Benefits Estimator
UX Capstone empowering over 2 million TRS members to understand the factors impacting their retirement benefits.
Timeline
12 weeks
Team
1 students
My Role
UX Designer & Researcher
Methods
Surveys · Interviews · Usability Testing · Competitor Analysis
My Responsibility and Roles


UX Research
Planned and conducted four phases of mixed-method UX research, including surveys, member interviews, competitive analysis, and usability testing


UX Design
Designed a high-fidelity interactive retirement benefits estimator in Figma, translating research findings into information architecture, user flows, and interface designs


Project Management
Lead the end-to-end project, created and managed timeline, and presented research and high-fidelity prototype to stakeholders
TRS at a glance
plus
The Problem
plus
The Solution
plus
Initial Research
I surveyed 80 TRS members to understand their demographics, knowledge of and confidence in TRS resources, use of retirement planning tools, and experiences with external planning resources.
Of the survey participants,

56%
indicated no confidence in knowing their expected monthly benefit payout.

56%
indicated no confidence in understanding the factors of their monthly benefit calculation.

52%
indicated that they had never received a payout estimate.
User Pain Points
42%
Difficulty accessing a personalized estimate or scenario planning tool
Personalization
46%
Struggling to find clear information about how benefits are calculated
Transparency
33%
Uncertain when or how to purchase service credits
Service Credit
Key Research Insights
Interviews and surveys with active TRS members revealed four interconnected themes driving confusion and disengagement with the portal.
Benefits feel abstract until retirement is near
Members rarely engage until within 5 years of retirement
–
Early-career teachers found the portal irrelevant to their situation
–
Urgency drove understanding — not clarity of content
–
Tier and salary rules are poorly understood
Most members could not correctly identify their membership tier
–
Three- vs. five-year salary averaging was consistently misunderstood
–
Members assumed TRS used their most recent salary, not their top 3 or 5 salaries, based on tier
–
The portal creates more questions than it answers
"I don't even know where to start" was a common sentiment
–
Members left the portal without finding what they needed
–
No scenario planning made retirement timing decisions feel impossible
–
Service credit purchasing lacks clarity
Many members were unaware they could purchase additional service credit
–
Eligibility rules and purchase windows felt nearly impossible to find
–
Members who purchased credit felt they figured it out on their own
–
The Four Factors of Redesign
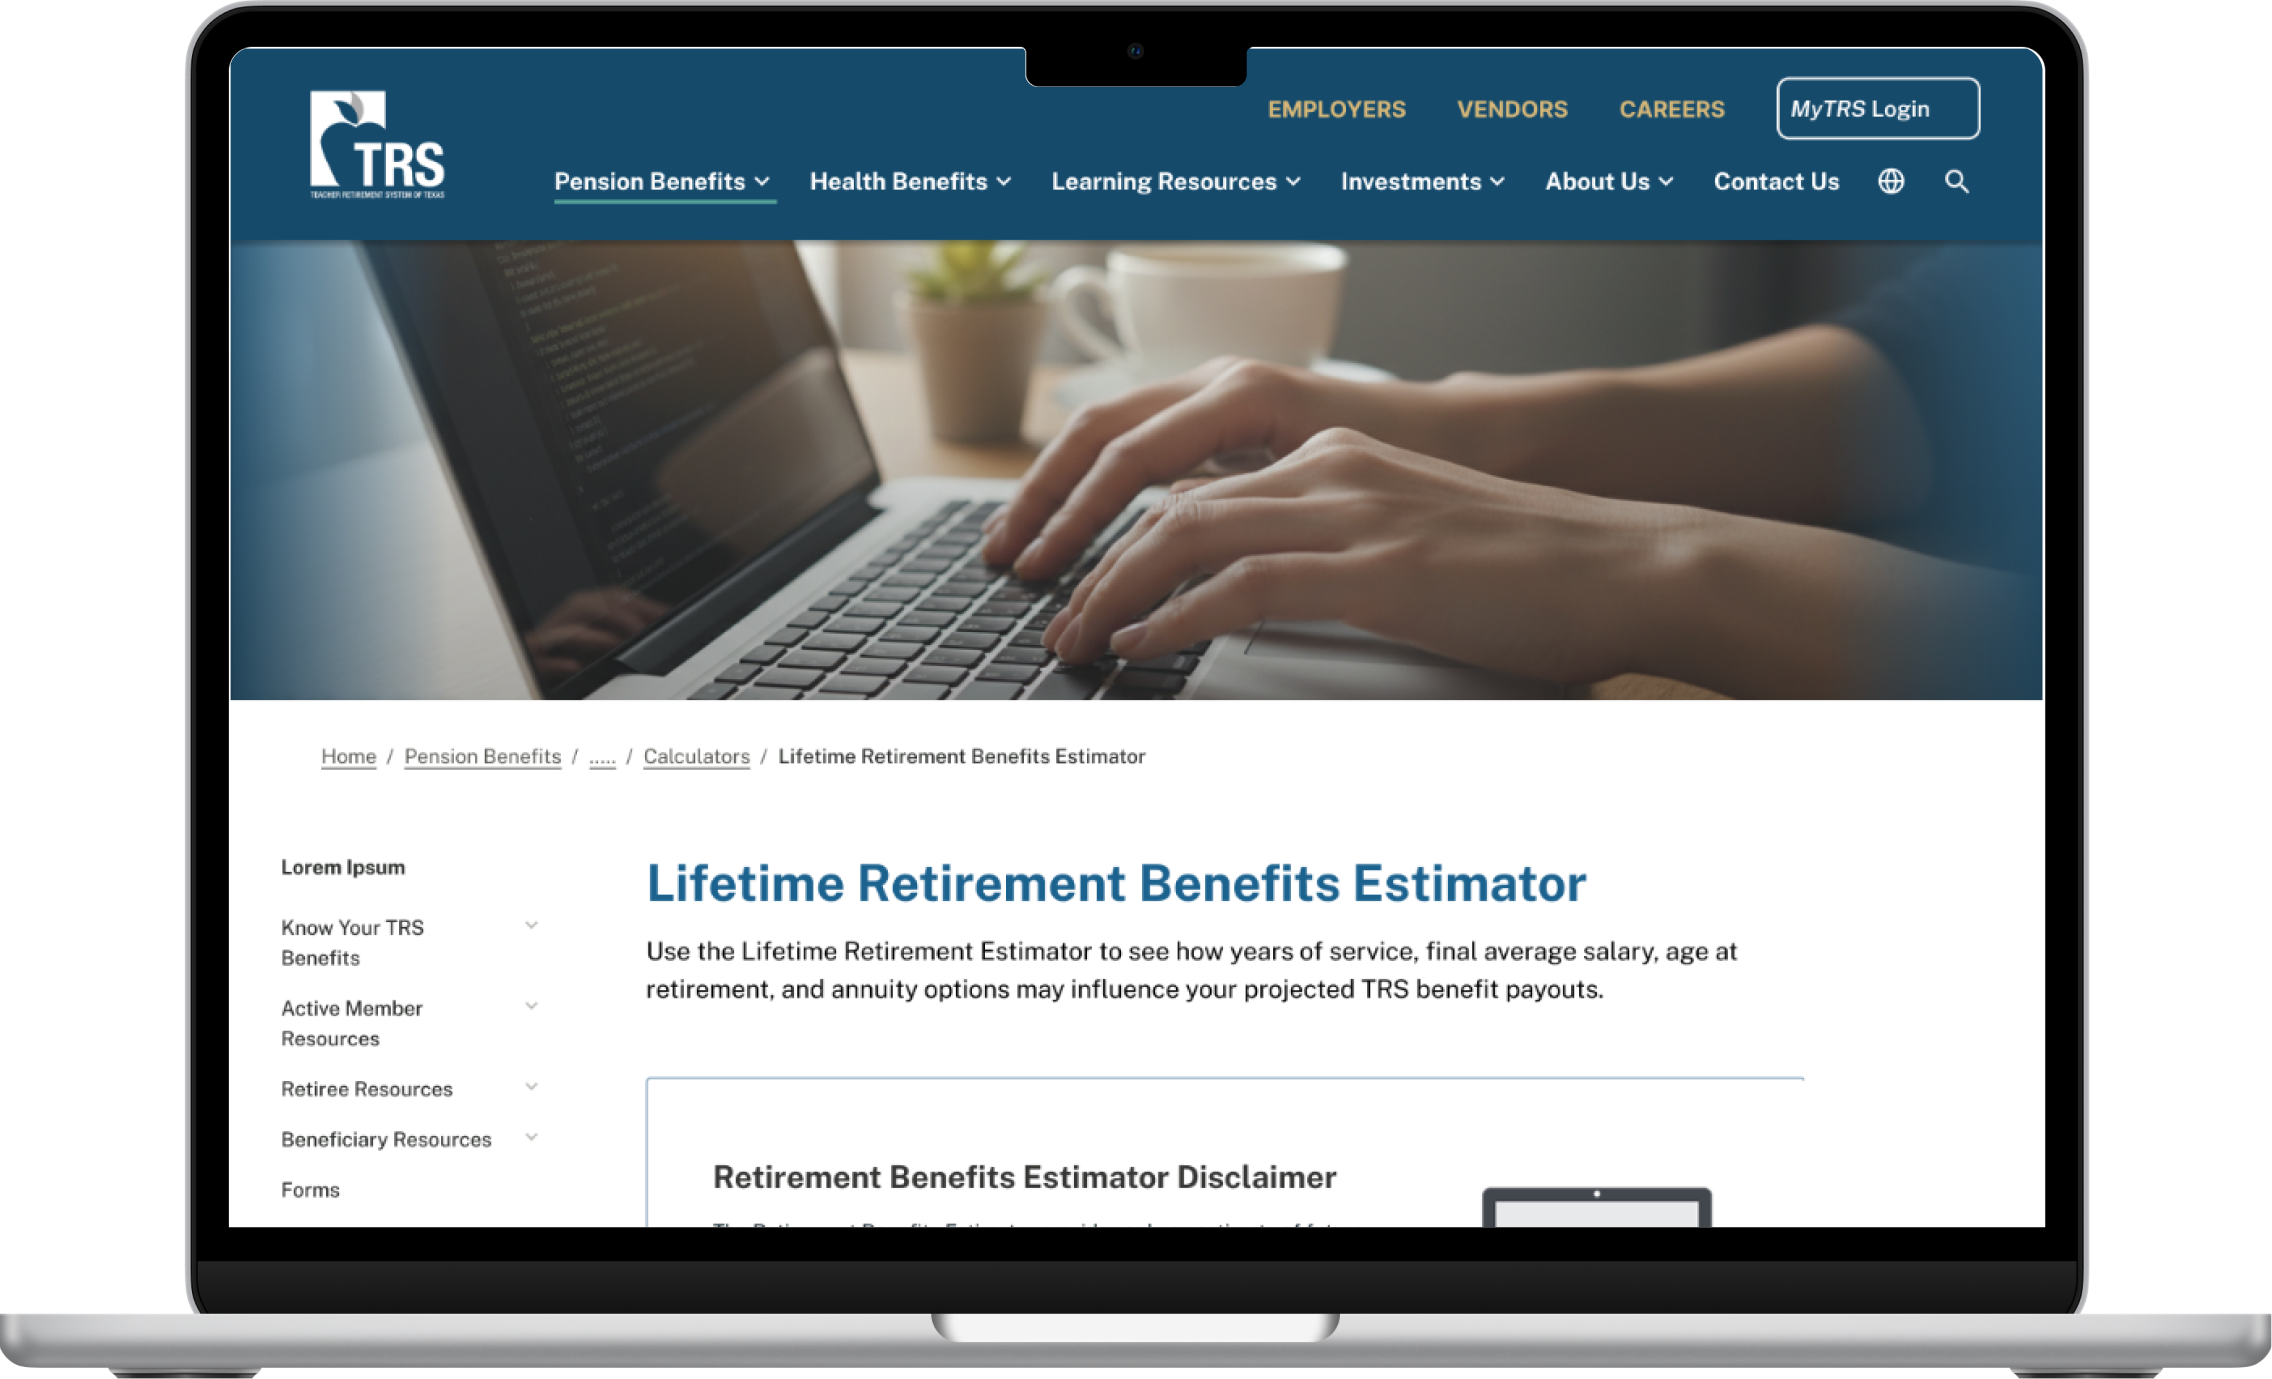
The redesign made four factors that govern every TRS benefit calculation visible, scannable, and interactive — each with a plain-language explanation tied directly to the estimator.
1
Know Your Membership Tier
Membership tier determines eligibility rules, reductions, and the Partial Lump Sum Option. Members can now find their tier and immediately see how it shapes their benefit formula.
2
Average of Top Salaries
TRS uses the three or five highest annual salaries — not the most recent — to establish Final Average Salary. The redesign allows users to determine a benefit payout based on their predicited
3
How Age Affects Benefits
Retiring earlier reduces the monthly benefit; waiting longer increases it. The estimator slider shows this relationship in real-time, replacing a confusing static table.
4
Total Years of TRS Service
Service credit affects eligibility, the disability benefit, and the annuity paid to beneficiaries. Members can now see vesting status and the impact of purchasing additional credit.
Hi-Fi Usability Testing
Six participants completed moderated usability sessions with the hi-fi prototype, rating seven statements on a 7-point Likert scale.
Statement
P1
P2
P3
P4
P5
P6
Avg
The flow of information is logical and easy to follow.
6
7
6
7
7
6
6.5
The information is presented in a way that is easy to understand.
5
7
6
7
6
7
6.3
I feel confident I understand how these factors impact retirement benefits.
6
7
4
7
6
5
5.8
The estimator is easy to understand.
7
7
7
7
7
6
6.8
The inputs (factors) are easy to adjust and interpret.
7
7
7
7
7
7
7
The results (estimated payout) are clear and meaningful.
7
7
7
7
7
5
6.7
I understand how the final benefit amount is calculated.
6
7
5
7
7
7
6.5
Scores of 7 are highlighted in teal. Scale: 1 (strongly disagree) – 7 (strongly agree). N = 6 participants.
Reflection
Designing for High-Stakes Decisions
Retirement planning happens a few times in a career, but those decisions carry decades of consequence. This project taught me that for high-stakes infrequent decisions, clarity and confidence matter more than efficiency. Removing one confused moment is worth more than saving five clicks.
The Limits of a Portal Redesign
Even with a well-designed estimator, confidence scores remained moderate for participants without prior TRS knowledge. A UI alone cannot substitute for education. Future work should explore proactive notifications, lifecycle-based onboarding, and advisor touchpoints.
Allow for multiple touchpoints for me
Lets work together

annaickes@gmail.com
UX Design and Research
TRS Benefits Estimator
UX Capstone empowering over 2 million TRS members to understand the factors impacting their retirement benefits.
Timeline
12 weeks
Team
1 students
My Role
UX Designer & Researcher
Methods
Surveys · Interviews · Usability Testing · Competitor Analysis
My Roles and Responsibilities
UX Research
Planned and conducted four phases of mixed-method UX research, including surveys, member interviews, competitive analysis, and usability testing
UX Design
Designed a high-fidelity interactive retirement benefits estimator in Figma, translating research findings into information architecture, user flows, and interface designs
Project Management
Lead the end-to-end project, created and managed timeline, and presented research and high-fidelity prototype to stakeholders
TRS at a glance
plus
The Problem
plus
The Solution
plus
Initial Research
I surveyed 80 TRS members to understand their demographics, knowledge of and confidence in TRS resources, use of retirement planning tools, and experiences with external planning resources.
Of the survey partcipants
56%
indicated no confidence in knowing their expected monthly benefit payout.
56%
indicated no confidence in understanding the factors of their monthly benefit calculation.
52%
indicated that they had never received a payout estimate.
User Pain Points
42%
Difficulty accessing a personalized estimate or scenario planning tool
Personalization
46%
Struggling to find clear information about how benefits are calculated
Transparency
33%
Uncertain when or how to purchase service credits
Service Credit
Key Research Insights
Interviews and surveys with active TRS members revealed four interconnected themes driving confusion and disengagement with the portal.
Benefits feel abstract until retirement is near
Members rarely engage until within 5 years of retirement
–
Early-career teachers found the portal irrelevant to their situation
–
Urgency drove understanding — not clarity of content
–
Tier and salary rules are poorly understood
Most members could not correctly identify their membership tier
–
Three- vs. five-year salary averaging was consistently misunderstood
–
Members assumed TRS used their most recent salary, not their top 3 or 5 salaries, based on tier
–
The portal creates more questions than it answers
"I don't even know where to start" was a common sentiment
–
Members left the portal without finding what they needed
–
No scenario planning made retirement timing decisions feel impossible
–
Service credit purchasing lacks clarity
Many members were unaware they could purchase additional service credit
–
Eligibility rules and purchase windows felt nearly impossible to find
–
Members who purchased credit felt they figured it out on their own
–
The Four Factors of Redesign
The redesign made four factors that govern every TRS benefit calculation visible, scannable, and interactive — each with a plain-language explanation tied directly to the estimator.
1
Know Your Membership Tier
Membership tier determines eligibility rules, reductions, and the Partial Lump Sum Option. Members can now find their tier and immediately see how it shapes their benefit formula.
2
Average of Top Salaries
TRS uses the three or five highest annual salaries — not the most recent — to establish Final Average Salary. The redesign allows users to determine a benefit payout based on their predicited
3
How Age Affects Benefits
Retiring earlier reduces the monthly benefit; waiting longer increases it. The estimator slider shows this relationship in real-time, replacing a confusing static table.
4
Total Years of TRS Service
Service credit affects eligibility, the disability benefit, and the annuity paid to beneficiaries. Members can now see vesting status and the impact of purchasing additional credit.
Hi-Fi Usability Testing
Six participants completed moderated usability sessions with the hi-fi prototype, rating seven statements on a 7-point Likert scale.
Statement
P1
P2
P3
P4
P5
P6
Avg
The flow of information is logical and easy to follow.
6
7
6
7
7
6
6.5
The information is presented in a way that is easy to understand.
5
7
6
7
6
7
6.3
I feel confident I understand how these factors impact retirement benefits.
6
7
4
7
6
5
5.8
The estimator is easy to understand.
7
7
7
7
7
6
6.8
The inputs (factors) are easy to adjust and interpret.
7
7
7
7
7
7
7
The results (estimated payout) are clear and meaningful.
7
7
7
7
7
5
6.7
I understand how the final benefit amount is calculated.
6
7
5
7
7
7
6.5
Scores of 7 are highlighted in teal. Scale: 1 (strongly disagree) – 7 (strongly agree). N = 6 participants.
Reflection
Designing for High-Stakes Decisions
Retirement planning happens a few times in a career, but those decisions carry decades of consequence. This project taught me that for high-stakes infrequent decisions, clarity and confidence matter more than efficiency. Removing one confused moment is worth more than saving five clicks.
The Limits of a Portal Redesign
Even with a well-designed estimator, confidence scores remained moderate for participants without prior TRS knowledge. A UI alone cannot substitute for education. Future work should explore proactive notifications, lifecycle-based onboarding, and advisor touchpoints.
Allow for multiple touchpoints for me
Lets work together
annaickes@gmail.com
UX Design and Research
TRS Benefits Estimator
UX Capstone empowering over 2 million TRS members to understand the factors impacting their retirement benefits.
Timeline
12 weeks
Team
1 students
My Role
UX Designer & Researcher
Methods
Surveys · Interviews · Usability Testing · Competitor Analysis
My Responsibility and Roles
UX Research
Planned and conducted four phases of mixed-method UX research, including surveys, member interviews, competitive analysis, and usability testing
UX Design
Designed a high-fidelity interactive retirement benefits estimator in Figma, translating research findings into information architecture, user flows, and interface designs
Project Management
Lead the end-to-end project, created and managed timeline, and presented research and high-fidelity prototype to stakeholders
TRS at a glance
plus
The Problem
plus
The Solution
plus
Initial Research
I surveyed 80 TRS members to understand their demographics, knowledge of and confidence in TRS resources, use of retirement planning tools, and experiences with external planning resources.
Of the survey participants,
56%
indicated no confidence in knowing their expected monthly benefit payout.
56%
indicated no confidence in understanding the factors of their monthly benefit calculation.
52%
indicated that they had never received a payout estimate.
User Pain Points
42%
Difficulty accessing a personalized estimate or scenario planning tool
Personalization
46%
Struggling to find clear information about how benefits are calculated
Transparency
33%
Uncertain when or how to purchase service credits
Service Credit
Key Research Insights
Interviews and surveys with active TRS members revealed four interconnected themes driving confusion and disengagement with the portal.
Benefits feel abstract until retirement is near
Members rarely engage until within 5 years of retirement
–
Early-career teachers found the portal irrelevant to their situation
–
Urgency drove understanding — not clarity of content
–
Tier and salary rules are poorly understood
Most members could not correctly identify their membership tier
–
Three- vs. five-year salary averaging was consistently misunderstood
–
Members assumed TRS used their most recent salary, not their top 3 or 5 salaries, based on tier
–
The portal creates more questions than it answers
"I don't even know where to start" was a common sentiment
–
Members left the portal without finding what they needed
–
No scenario planning made retirement timing decisions feel impossible
–
Service credit purchasing lacks clarity
Many members were unaware they could purchase additional service credit
–
Eligibility rules and purchase windows felt nearly impossible to find
–
Members who purchased credit felt they figured it out on their own
–
The Four Factors of Redesign
The redesign made four factors that govern every TRS benefit calculation visible, scannable, and interactive — each with a plain-language explanation tied directly to the estimator.
1
Know Your Membership Tier
Membership tier determines eligibility rules, reductions, and the Partial Lump Sum Option. Members can now find their tier and immediately see how it shapes their benefit formula.
2
Average of Top Salaries
TRS uses the three or five highest annual salaries — not the most recent — to establish Final Average Salary. The redesign allows users to determine a benefit payout based on their predicted salaries.
3
How Age Affects Benefits
Retiring earlier reduces the monthly benefit; waiting longer increases it. The estimator slider shows this relationship in real-time, replacing a confusing static table.
4
Total Years of TRS Service
Service credit affects eligibility, the disability benefit, and the annuity paid to beneficiaries. Members can now see vesting status and the impact of purchasing additional credit.
Hi-Fi Usability Testing
Six participants completed moderated usability sessions with the hi-fi prototype, rating seven statements on a 7-point Likert scale.
Statement
P1
P2
P3
P4
P5
P6
Avg
The flow of information is logical and easy to follow.
6
7
6
7
7
6
6.5
The information is presented in a way that is easy to understand.
5
7
6
7
6
7
6.3
I feel confident I understand how these factors impact retirement benefits.
6
7
4
7
6
5
5.8
The estimator is easy to understand.
7
7
7
7
7
6
6.8
The inputs (factors) are easy to adjust and interpret.
7
7
7
7
7
7
7
The results (estimated payout) are clear and meaningful.
7
7
7
7
7
5
6.7
I understand how the final benefit amount is calculated.
6
7
5
7
7
7
6.5
Scores of 7 are highlighted in teal. Scale: 1 (strongly disagree) – 7 (strongly agree). N = 6 participants.
Reflection
Designing for High-Stakes Decisions
Retirement planning happens a few times in a career, but those decisions carry decades of consequence. This project taught me that for high-stakes infrequent decisions, clarity and confidence matter more than efficiency. Removing one confused moment is worth more than saving five clicks.
The Limits of a Portal Redesign
Even with a well-designed estimator, confidence scores remained moderate for participants without prior TRS knowledge. A UI alone cannot substitute for education. Future work should explore proactive notifications, lifecycle-based onboarding, and advisor touchpoints.
Allow for multiple touch points for member education and engagement.
Lets work together
annaickes@gmail.com